U.S. Department of Transportation
Federal Highway Administration
1200 New Jersey Avenue, SE
Washington, DC 20590
202-366-4000
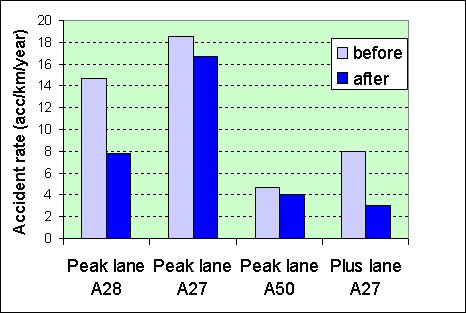
Figure 37. Bar chart of accident reductions for Dutch temporary shoulder use. Roadways are on the x axis and accident rate, or accidents per kilometer per year, are on the y axis. On A28, the rate was about 14.5 accidents per kilometer per year before the addition of a peak lane and 8 after. On A27, the accident rate was more than 18 before the addition of a peak lane and about 16.5 after. On A50, the accident rate was about 4.5 before the addition of a peak lane and 4 after. On A27, the accident rate was 8 before the addition of a plus lane and about 3 after.

